
Observability
Northplane exposes its own health through a handful of HTTP endpoints, an OpenMetrics exposition, structured logs on stderr and a hash-chained audit log. This page covers all of them, plus the background workers you will see in those logs and the one request deadline that affects every API client.
Endpoints at a glance
Section titled “Endpoints at a glance”| Endpoint | Auth | Purpose |
|---|---|---|
GET /healthz |
none | liveness: 200 with body ok as soon as the listener is up |
GET /readyz |
none | readiness: JSON per subsystem, 503 when any is not ok |
GET /api/v1/system/health |
none (anonymous) | queue depths, scheduler/pipeline/alerting/notify/TSDB counters |
GET /api/v1/system/info |
none (anonymous) | version, Go version, goroutines, heap, uptime, storage dialect, AI enabled |
GET /metrics |
none | OpenMetrics text for Prometheus |
GET /api/v1/overview |
objects:read |
the UI’s overview numbers (state summary, open alerts, incidents, queues) |
GET /api/docs, GET /api/openapi.json |
none | Swagger UI and the OpenAPI 3.1 document |
Liveness and readiness
Section titled “Liveness and readiness”/healthz performs no checks — it answers ok as soon as the HTTP server accepts connections, which makes it the right probe for a proxy health check (Caddy: health_uri /healthz) and for the CI deploy verification.
/readyz aggregates subsystems:
{"ready":true,"subsystems":[{"name":"storage","ok":true,"info":"sqlite"},{"name":"eventbus","ok":true},{"name":"scheduler","ok":true}]}| Subsystem | Criterion |
|---|---|
storage |
database ping succeeds; info is sqlite or postgres |
eventbus |
results queue depth below 8000 (a saturated pipeline makes the instance not-ready) |
scheduler |
always true in this version |
Any false turns the response into HTTP 503. Use /readyz for orchestrator readiness gates and for make dev, which waits for it after each rebuild.
System health and info
Section titled “System health and info”GET /api/v1/system/health returns the live counters of every subsystem:
{ "queues": {"resultsDepth":0,"eventsDepth":0,"notifyDepth":0,"aiDepth":0,"subscribers":3,"droppedAi":0,"droppedSubscriberMessages":0}, "scheduler": {"scheduled":142,"queueDepth":0,"dispatched":8841,"maxLagMs":12}, "pipeline": {"processed":8830,"workingSet":142}, "alerting": {"rules":6,"pending":0,"matched":19,"opened":4}, "notify": {"sent":12,"failed":1,"dead":0,"dropped":0}, "tsdb": {"series":318,"samplesIngested":105220,"samplesDropped":0,"seriesDropped":0,"blocks":36,"walBytes":41250}, "catalog": 142, "sse": 3}GET /api/v1/system/info:
{"version":"main-daa6dc518a2b","goVersion":"go1.25.14","goroutines":44,"heapMB":134,"startedAt":"2026-08-23T08:50:57Z","uptime":"22m57s","storage":"sqlite","aiEnabled":false}np doctor prints both documents (--- system/info ---, --- system/health ---) and fails with server unreachable when the server does not answer — a quick first check from any machine with NP_SERVER/NP_TOKEN set (np CLI). The version string is also returned by northplaned version, in the OpenAPI info.version, in the MCP server implementation, in the footer of the login/setup/register pages and in every federation heartbeat (see Upgrades).
Prometheus metrics
Section titled “Prometheus metrics”GET /metrics serves application/openmetrics-text; version=1.0.0; charset=utf-8, terminated by # EOF, from a dependency-free in-process registry. It exports server self-metrics only — no per-object perfdata; monitored metrics live in the NP-TSDB and are queried through POST /api/v1/metrics/query (see Metrics and NP-TSDB).
| Family | Type | Labels | Meaning |
|---|---|---|---|
np_http_requests_total |
counter | method, status, route |
API requests under /api/; route is the matched mux pattern (custom-verb routes appear in their internal form, e.g. /api/v1/alerts/{__seg}; empty for 404s) |
np_http_request_duration_seconds |
histogram (_bucket, _sum, _count) |
method, status, route |
Prometheus default buckets 0.005 … 10 s + +Inf |
np_queue_results_depth |
gauge | — | check results waiting for the pipeline |
np_queue_events_depth |
gauge | — | events waiting on the bus |
np_queue_notifications_depth |
gauge | — | notifications waiting for the outbox worker |
np_sse_clients |
gauge | — | connected SSE subscribers |
np_scheduler_objects |
gauge | — | objects currently scheduled |
np_scheduler_lag_ms_max |
gauge | — | worst scheduling lag in the last window |
np_checks_dispatched_total |
gauge (see note) | — | checks handed to the executor since start |
np_results_processed_total |
gauge (see note) | — | results processed by the pipeline since start |
np_alert_rules |
gauge | — | compiled alert rules |
np_alerts_opened_total |
gauge (see note) | — | alerts opened since start |
np_notifications_total |
gauge (see note) | result = sent | failed | dead |
notification outcomes since start |
np_events_dropped_total |
gauge / counter | source = notify | api |
events that could not be persisted |
np_tsdb_series |
gauge | — | series in the NP-TSDB registry |
np_tsdb_samples_total |
gauge (see note) | — | samples ingested since start |
np_tsdb_wal_bytes |
gauge | — | size of the TSDB WAL |
np_catalog_objects |
gauge | — | objects in the in-memory catalog |
np_ingress_events_total |
counter | type = webhook | alertmanager | sms |
accepted ingest events |
np_ingress_dropped_total |
counter | reason = rate |
ingest requests rejected by the per-source rate limit |
A minimal scrape job:
scrape_configs: - job_name: northplane scheme: https metrics_path: /metrics static_configs: - targets: ["monitoring.example.net:443"]Useful alerts: np_queue_results_depth growing (pipeline stalled — the same condition that turns /readyz red at 8000 and pauses the dead-man ping at 7000), rate(np_notifications_total{result="failed"}[10m]), np_ingress_dropped_total increasing (a source needs a higher rateLimit/burst), np_tsdb_series approaching the 100 000 cap.
- Structured logging via Go
slog, always to stderr. Formatjson(default) ortext(logFormat/NORTHPLANE_LOG_FORMAT); leveldebug/info/warn/error(logLevel/NORTHPLANE_LOG_LEVEL, defaultinfo).northplaned mcpforces text because stdout belongs to the MCP transport. - There is no log file and no rotation inside Northplane: under systemd read them with
journalctl -u northplaned -f; in containers withdocker compose logs -f northplane. - Lines worth knowing (message field):
| Message | Meaning |
|---|---|
storage: applying migration (version, name) |
a schema migration is running at start |
server: generated secret-store master key / server: configured secretKeyFile unusable — falling back to the data directory / server: secret store disabled (no usable master key) |
secret-store key provisioning; see Secrets |
seeded default admin with a GENERATED password — save it now, it is not recoverable (WARN, with email, password) / seeded default admin — CHANGE THE PASSWORD |
break-glass admin created at start; see Authentication |
server: serving plaintext HTTP (loopback/dev or behind a TLS-terminating proxy — A-15.10 requires TLS in production) |
no certificate configured; expected behind Caddy |
northplane: listening (addr, scheme, storage, objects, ai) |
the server is up |
first run: open <url>/setup to create your admin account (WARN) |
the /setup gate is open (only when no local user and no API token exist) |
federation: edge mode |
edge federation active |
demo: user ready, demo: hint, demo: environment seeded |
demo seeding; see Demo mode |
NORTHPLANE_DEMO is set but this database already holds real (non-demo) hosts — skipping demo seeding … (WARN) |
the real-data guard refused to seed |
server: background worker panicked; restarting (worker, panic, stack) |
a supervised worker crashed and will restart after 1 s |
deadman: skipping ping, results queue saturated (WARN) |
dead-man ping withheld because the pipeline is stalled |
janitor: event segments dropped (segments) |
nightly retention removed old event months |
northplane: shutting down → northplane: background workers drained or northplane: shutdown budget elapsed, workers still running |
graceful stop (30 s budget) |
Every API response also carries an X-Request-Id (UUIDv7); the same id is stored in audit entries, which lets you correlate a client-side error with the server-side record.
Audit log
Section titled “Audit log”Every mutation performed through the API is recorded in an append-only, hash-chained audit log — object and config document changes (host.create, service.update, template.delete, alert-rule.create, …), alert operations (alert.ack, alert.resolve, alert.snooze, alert.raise), maintenance (downtime.create, silence.delete), administration (user.create, token.create, token.rotate, secret.put — without the value, role.update, tenant.create, bundle.apply, branding.update), logins (login.local, login.ldap, setup.admin, user.register), federation (federation.apply) and all AI actions (ai.*). Reads are not audited; neither are OIDC logins, failed logins or logouts.
Each entry: seq, ts (RFC 3339 UTC), tenantId, actorType (user | token | ai_agent | system), actorId, action, resource, sourceIp (TCP peer — the proxy’s address behind a reverse proxy), requestId, before, after (JSON snapshots), prevHash, hash. The hash is SHA-256 over the previous hash and the fields in fixed order; the genesis prevHash is 64 zeros. Verification re-walks the whole table and reports the first break.
| Operation | How |
|---|---|
| Browse | Admin → Audit log (Audit-Log); GET /api/v1/audit (admin:audit) with filters actorId, actorType, action (prefix), resource, limit (default 200, max 5000), afterSeq (newest first) |
| Export to a SIEM | GET /api/v1/audit:export — NDJSON, ascending, the whole tenant; UI link “NDJSON (SIEM)” |
| Verify the chain | POST /api/v1/audit:verify → {"intact":true,"verified":N} or {"intact":false,"verified":N,"error":"audit chain broken at seq N: …"}; CLI np audit verify prints audit chain intact (N entries verified) or exits non-zero with AUDIT CHAIN BROKEN after N entries: … |
| Tail | np audit tail — the last 30 entries as a table |
Things to be aware of: the audit log is never purged (plan disk accordingly or export and truncate manually); audit:export is not on the list of streaming paths, so a very large export can hit the 30 s request deadline — page with GET /api/v1/audit?afterSeq=… in that case; on PostgreSQL the jsonb normalisation can make verification report a false break (see Storage). Verification walks all tenants; search and export are per tenant.
Dead-man switch
Section titled “Dead-man switch”Northplane can prove that it is alive to an external monitor: set deadManUrl (env NORTHPLANE_DEADMAN_URL) to a healthchecks.io-compatible ping URL and the dead-man worker issues a GET every deadManInterval (default 1m, values <= 0 mean 1m) with a 10 s client timeout. The ping is skipped (with the warning above) while the results queue holds more than 7000 items, so a stalled check pipeline makes the external monitor fire even though the process is running.
deadManUrl: "https://hc-ping.com/<uuid>"deadManInterval: 1mDo not confuse this outgoing ping with the Heartbeat resource, which is the inbound dead-man input for your own cron jobs and integrations (POST /api/v1/heartbeats/{name}/beat, heartbeat_missed events). That one is documented in Heartbeats.
Admin → System health tab
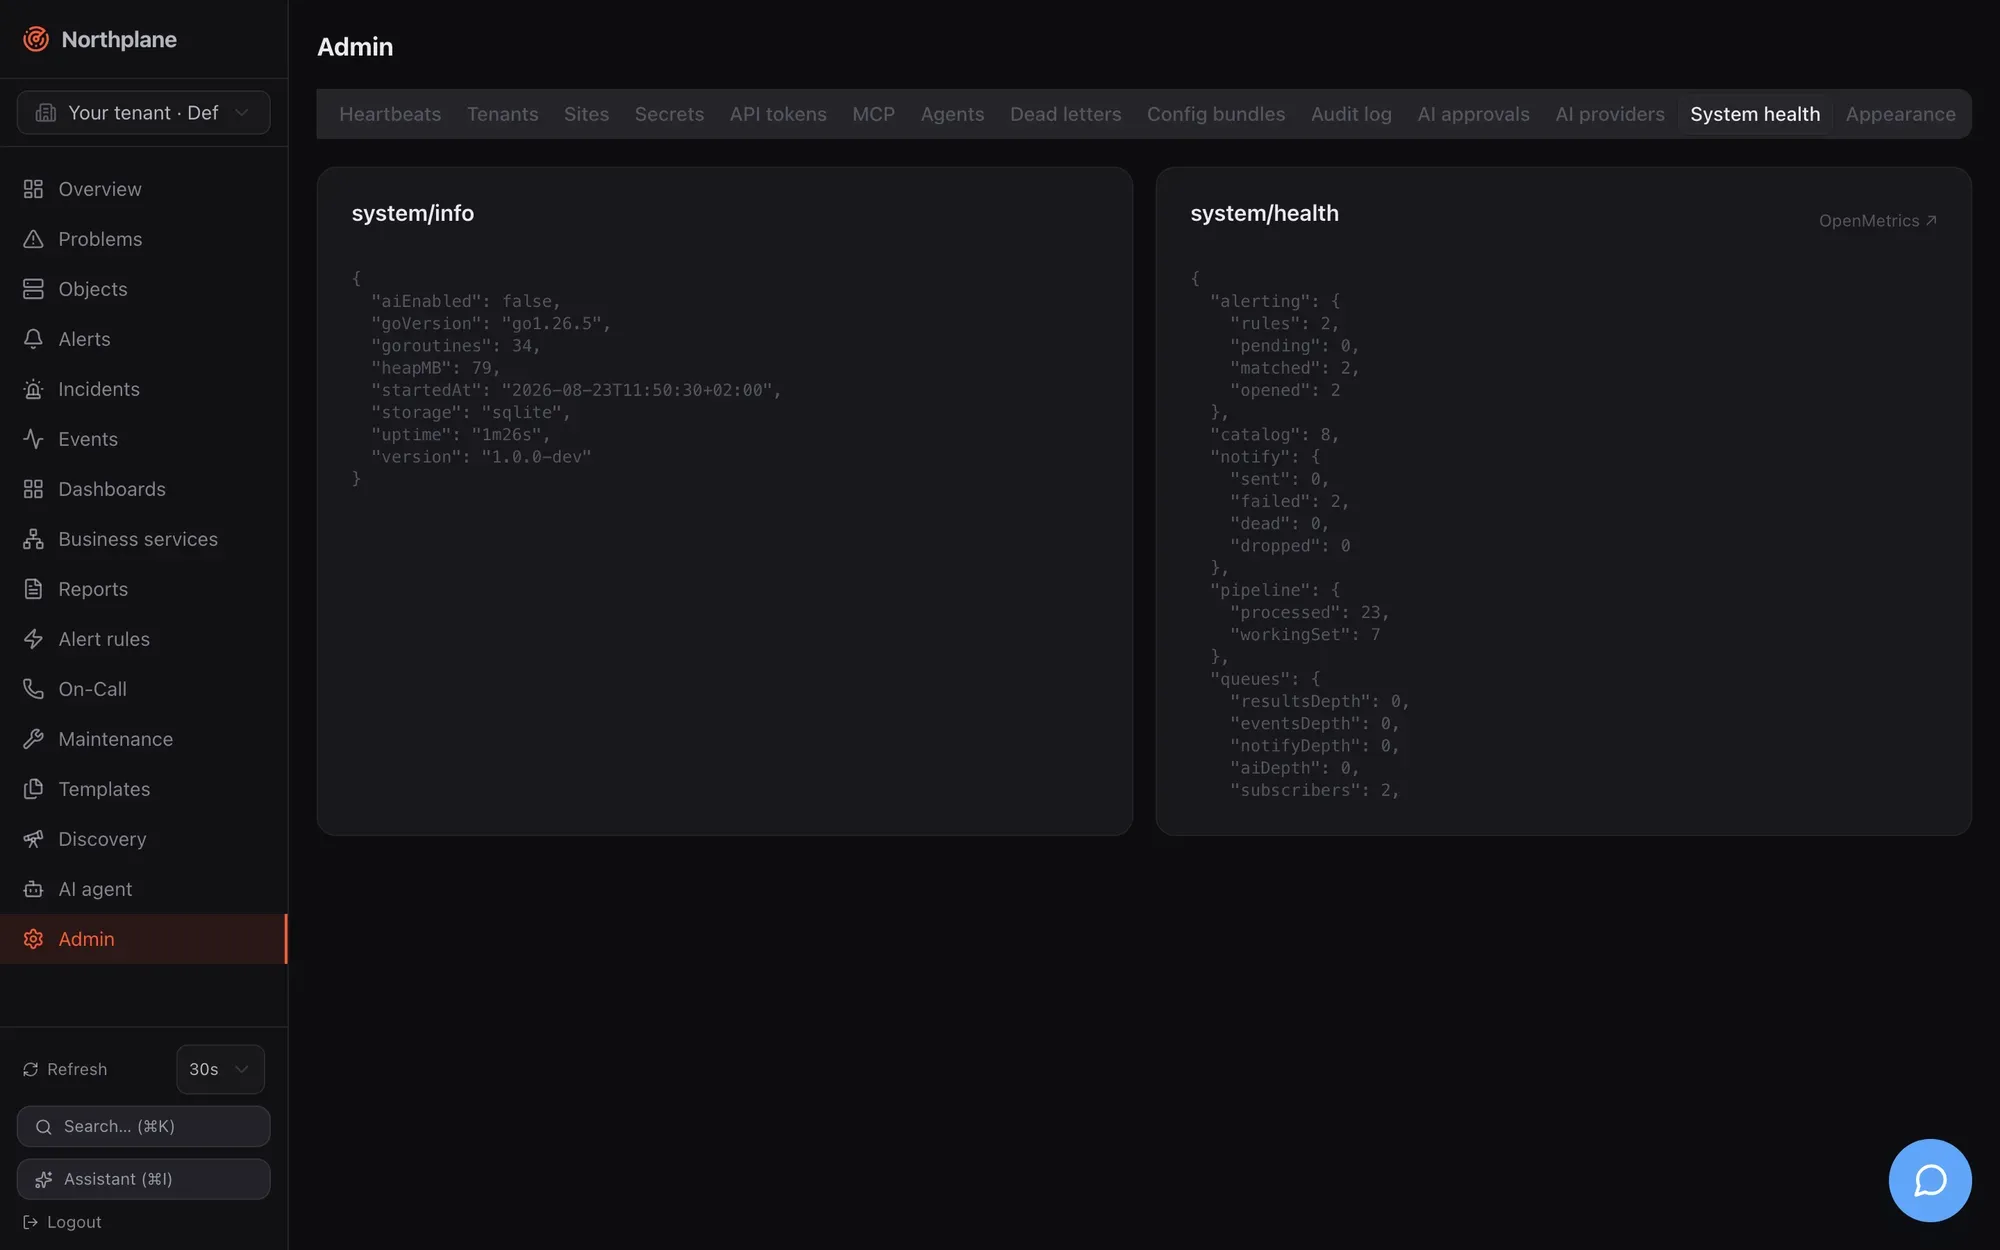
Section titled “Admin → System health tab”Admin → System health (System-Health) shows two cards: the raw JSON of system/info (version, runtime) and system/health (refreshed every 10 s), with an OpenMetrics link that opens /metrics. It is the place to look when the Overview feels stale: growing queues.resultsDepth or scheduler.maxLagMs, notify.failed/dead counters, tsdb.seriesDropped. Dead letters themselves live in Admin → Dead letters (Dead-Letters) (Reliability).
Background workers and supervision
Section titled “Background workers and supervision”serve runs every subsystem as a supervised goroutine: a panic is recovered, logged with its stack, and the worker restarts after 1 s (workerRestartBackoff), so one misbehaving integration cannot take the process down. Worker names as they appear in logs:
| Worker | Role |
|---|---|
scheduler, executor, pipeline |
schedule checks, run them, turn results into state and events |
alerting, correlator, escalation, notify |
rules → alerts, incident correlation, escalation timers, outbox delivery |
traps, mailin, mqttin, espa, agi |
SNMP trap receiver, IMAP poller, MQTT subscriber, ESPA/ESPA-X listeners, FastAGI listener |
api-janitor |
periodic maintenance (table below) |
webhook-dispatcher |
outgoing webhook subscriptions |
report-scheduler |
scheduled reports (first tick 10 s after start, then every minute) |
dead-man |
the outgoing ping above |
ldap-sync (when LDAP is configured), federation-edge (edge mode), ai (AI service) |
conditional workers |
The janitor’s schedule:
| Cadence | Work |
|---|---|
| every 30 s | recompute downtime depths and trigger flexible downtimes for every tenant |
| every 10 min | delete expired sessions and idempotency rows older than 24 h |
| hourly | flush closed TSDB windows; between 02:00 and 03:59 local time (at most once per 20 h) run full TSDB maintenance (downsample + retention) and event retention |
Alert auto-close (autoCloseAfter) and snooze wake-ups run inside the alerting engine loop; heartbeat misses are swept every 5 s.
On SIGINT/SIGTERM the HTTP server stops accepting connections and all workers get a shared 30 s budget to drain; the store and TSDB are closed afterwards (close failed is logged if that fails).
The 30 s request timeout
Section titled “The 30 s request timeout”Every ordinary request is wrapped in a 30 s response deadline (http.TimeoutHandler): when the handler has not finished, the client receives HTTP 503 with the plain-text body request timeout (not a problem+json document). Exempt — and therefore unbounded — are the streaming paths /api/v1/stream (SSE), /api/v1/events:export (NDJSON), /api/v1/ai/chat (agent chat) and /mcp, /mcp/*. Long synchronous operations that can approach the limit on large tenants: audit:export, config/bundles:export, large objects:batch calls and report rendering. The other server timeouts (ReadHeaderTimeout 10 s, ReadTimeout 60 s, IdleTimeout 120 s) are listed in Configuration → Not configurable; proxy settings that match them are in TLS and reverse proxies.