
Dashboards
A dashboard is a named grid of widgets: KPI counters, problem and alert lists, object tables, metric charts, stats, gauges, donuts, bars, business-service trees and free text. Dashboards are stored as config documents (/api/v1/dashboards), so you can create them in the UI, with np apply bundles, or through the AI agent. Open one with ?wallboard to get a chrome-free, auto-refreshing screen for a NOC display.
Where to find it
Section titled “Where to find it”Dashboards in the sidebar lists all dashboards of the current tenant as cards (name, Shared (Geteilt) badge, widget count, Open, delete). New dashboard (Dashboard anlegen) asks for a name and the shared switch and creates the dashboard with a single counters widget, then opens it.
The dashboard view has:
| Control | What it does |
|---|---|
| Time range select | 1h 3h 6h 12h 24h 7d 30d — overrides the range of every time-series widget (metric, stat) |
| Refresh select | Off (Aus), 10 s, 30 s, 1 min, 5 min — every widget re-fetches at this interval (default 30 s) |
| Refresh-now button | invalidates all widget queries immediately |
| Wallboard | opens /dashboards/<name>?wallboard |
| Edit (Bearbeiten) | enters edit mode |
In edit mode: + Add widget (Widget hinzufügen), Tidy (Aufräumen) (re-flows all panels left-to-right and closes gaps), Cancel, Save. Drag a panel by its header, resize it from the bottom-right grip; the rest of the grid reflows live. Hovering a panel shows Configure, Duplicate and Remove. The panel dialog offers title, width (1–12 columns), height (1–8 rows), the type-specific fields and a live preview; the add dialog shows an icon gallery of all types first.
Save writes spec.widgets, spec.time and spec.refresh with PUT /api/v1/dashboards/{name} and the held ETag; if another tab saved in the meantime (409), the UI re-fetches once and retries on the fresh version.
Grid and layout
Section titled “Grid and layout”- 12 columns, row height 120 px, 12 px margins. Widget
wis the column span (1–12),hthe row span (1–8);x/yis the top-left cell. x/yare optional for documents written by hand or older versions: widgets without positions are auto-flowed left-to-right, top-to-bottom on load. New and duplicated widgets are placed at the bottom of the grid.
Wallboard mode
Section titled “Wallboard mode”/dashboards/<name>?wallboard renders the dashboard without sidebar and controls, with a large title, the Northplane logo and a clock; widgets refresh at the dashboard’s saved refresh interval (default 30 s) and use its saved time range. It is the same page with the same authentication — a wallboard browser needs a logged-in session (or a reverse proxy that injects one); there is no anonymous share link.
Widget types
Section titled “Widget types”All widgets share type, optional title (the type label is shown when empty) and the grid fields x, y, w, h. Time-series widgets honour the dashboard time range; everything else refreshes at the dashboard refresh interval. Selectors use the label selector grammar.
type |
Label (EN / DE) | Default size | Config fields | Data and rendering |
|---|---|---|---|---|
counters |
Counters (KPIs) / Zähler (KPIs) | 12 × 1 | — | GET /overview; six tiles: hosts up, hosts down, services OK, warning, critical, open alerts (critical + warning); each tile links to the filtered objects or alerts list |
problems |
Problems / Probleme | 6 × 2 | limit (1–50, default 10), selector |
GET /problems?limit&selector; hard non-OK objects: state, host / name, output, time since last hard change; links to the object |
alerts |
Alerts / Alarme | 6 × 2 | limit (1–50, default 10) |
GET /alerts?status=open&limit; severity badge, title, age; links to the alerts page |
table |
Table (hosts/services) / Tabelle | 12 × 2 | scope (hosts, services, unset = both), selector, query (full-text on name/spec), limit (1–100, default 15) |
objects list (/hosts, /services or /objects) with state, name, output, last check; rows link to the object |
metric |
Metric chart / Metrik-Diagramm | 6 × 2 | object or selector (overlay one metric across many objects), metric (empty = all metrics of the object), range (default 3h), warn, crit |
POST /metrics/query (maxPoints: 300); one chart per unit group; dashboard range overrides range |
stat |
Single value (stat) / Einzelwert | 3 × 2 | object, metric, range (default 6h), warn, crit |
POST /metrics/query (maxPoints: 60); latest value in big type, colour by threshold, tiny sparkline over the range |
gauge |
Gauge / Gauge (Tacho) | 3 × 2 | object, metric, max (scale end), warn, crit |
last value of the last hour; 240° SVG arc with amber/red zones; max defaults to the crit value, else max(100, value × 1.25) |
donut |
Status donut / Status-Donut | 4 × 2 | scope (services default, hosts) |
GET /overview; state distribution with legend and percentages; slices and legend rows link to the filtered objects list |
bar |
Bar chart / Balkendiagramm | 6 × 2 | object, metric (filter; empty = all), limit (1–20, default 8), warn, crit; max (scale end, JSON/API only — not in the dialog) |
last value per metric of one object, sorted descending, threshold-coloured horizontal bars; without any threshold or max only values are shown |
bpi |
Business service / Business Service | 6 × 2 | service (business service name) |
GET /business-services:tree; the named subtree with live state glyphs (whole forest when the name is empty or not found) — see Business services |
markdown |
Text / Markdown | 6 × 1 | text |
rendered as plain, whitespace-preserving text — no Markdown or HTML is interpreted (deliberately XSS-safe) |
Threshold fields: warn/crit are numbers that override the thresholds stored with the metric’s perfdata; leave them empty to use the plugin’s own ranges. Because perfdata thresholds are stored in the plugin’s original unit while values are normalised, set explicit overrides for metrics reported in ms, KB, MB or GB — see Metrics and NP-TSDB. np_* series are never shown.
Widgets that need metrics require metrics:read; the alerts widget alerts:read; everything else objects:read. The built-in viewer role has all of them.
Document format
Section titled “Document format”The server treats spec as an opaque JSON blob; the shape is owned by the UI and validated there with a zod schema (dashboardDocSchema) when a dashboard is read. A document that does not match the schema makes the dashboard page fail with one 502 invalid_response error instead of a half-rendered grid.
{ "name": "NOC", "shared": true, "spec": { "time": "24h", "refresh": "30s", "widgets": [ {"type": "counters", "x": 0, "y": 0, "w": 12, "h": 1}, {"type": "problems", "title": "Production problems", "selector": "env=prod", "limit": 20, "x": 0, "y": 1, "w": 6, "h": 3}, {"type": "metric", "title": "Web latency", "selector": "role=web", "metric": "time", "range": "3h", "warn": 1, "crit": 3, "x": 6, "y": 1, "w": 6, "h": 3}, {"type": "bpi", "service": "webshop", "x": 0, "y": 4, "w": 6, "h": 2}, {"type": "markdown", "title": "Runbook", "text": "Escalate to network on-call if the gateway is down.", "x": 6, "y": 4, "w": 6, "h": 1} ] }}| Field | Allowed values |
|---|---|
spec.time |
1h, 3h, 6h, 12h, 24h, 7d, 30d — default 3h when absent |
spec.refresh |
off, 10s, 30s, 1m, 5m — default 30s when absent or unknown |
spec.widgets[].type |
one of the 11 types above |
| other widget fields | title, object, metric, range, warn, crit, max, scope (services|hosts), limit, selector, query, service, text, w, h, x, y — all optional; numbers for warn, crit, max, limit, w, h, x, y |
Dashboards use the generic resource CRUD: GET /api/v1/dashboards, POST /api/v1/dashboards, GET|PUT|DELETE /api/v1/dashboards/{name}. Reads need objects:read, writes config:write; PUT requires If-Match with the current version. See REST API overview and the generated reference, e.g. post_dashboards.
NP=https://np.example.comTOK=np_…curl -s -X POST "$NP/api/v1/dashboards" -H "Authorization: Bearer $TOK" \ -H 'Content-Type: application/json' \ -d '{"name":"NOC","shared":true,"spec":{"time":"24h","refresh":"30s","widgets":[ {"type":"counters","w":12,"h":1}, {"type":"problems","title":"Open problems","limit":20,"selector":"env=prod","w":6,"h":3}, {"type":"metric","title":"web01 latency","object":"<object-id>","metric":"time","range":"3h","w":6,"h":3}]}}'Bundle
Section titled “Bundle”In a config bundle the kind is Dashboard. The bundle’s spec: (or data:) map holds the document fields, so the widget spec is nested one level:
kind: Dashboardmetadata: name: NOCspec: shared: true spec: time: 24h refresh: 30s widgets: - {type: counters, w: 12, h: 1} - {type: problems, title: Open problems, selector: env=prod, limit: 20, w: 6, h: 3} - {type: donut, scope: hosts, w: 4, h: 2}np export produces exactly this shape. Fields absent from the bundle are left untouched on apply.
Demo dashboard
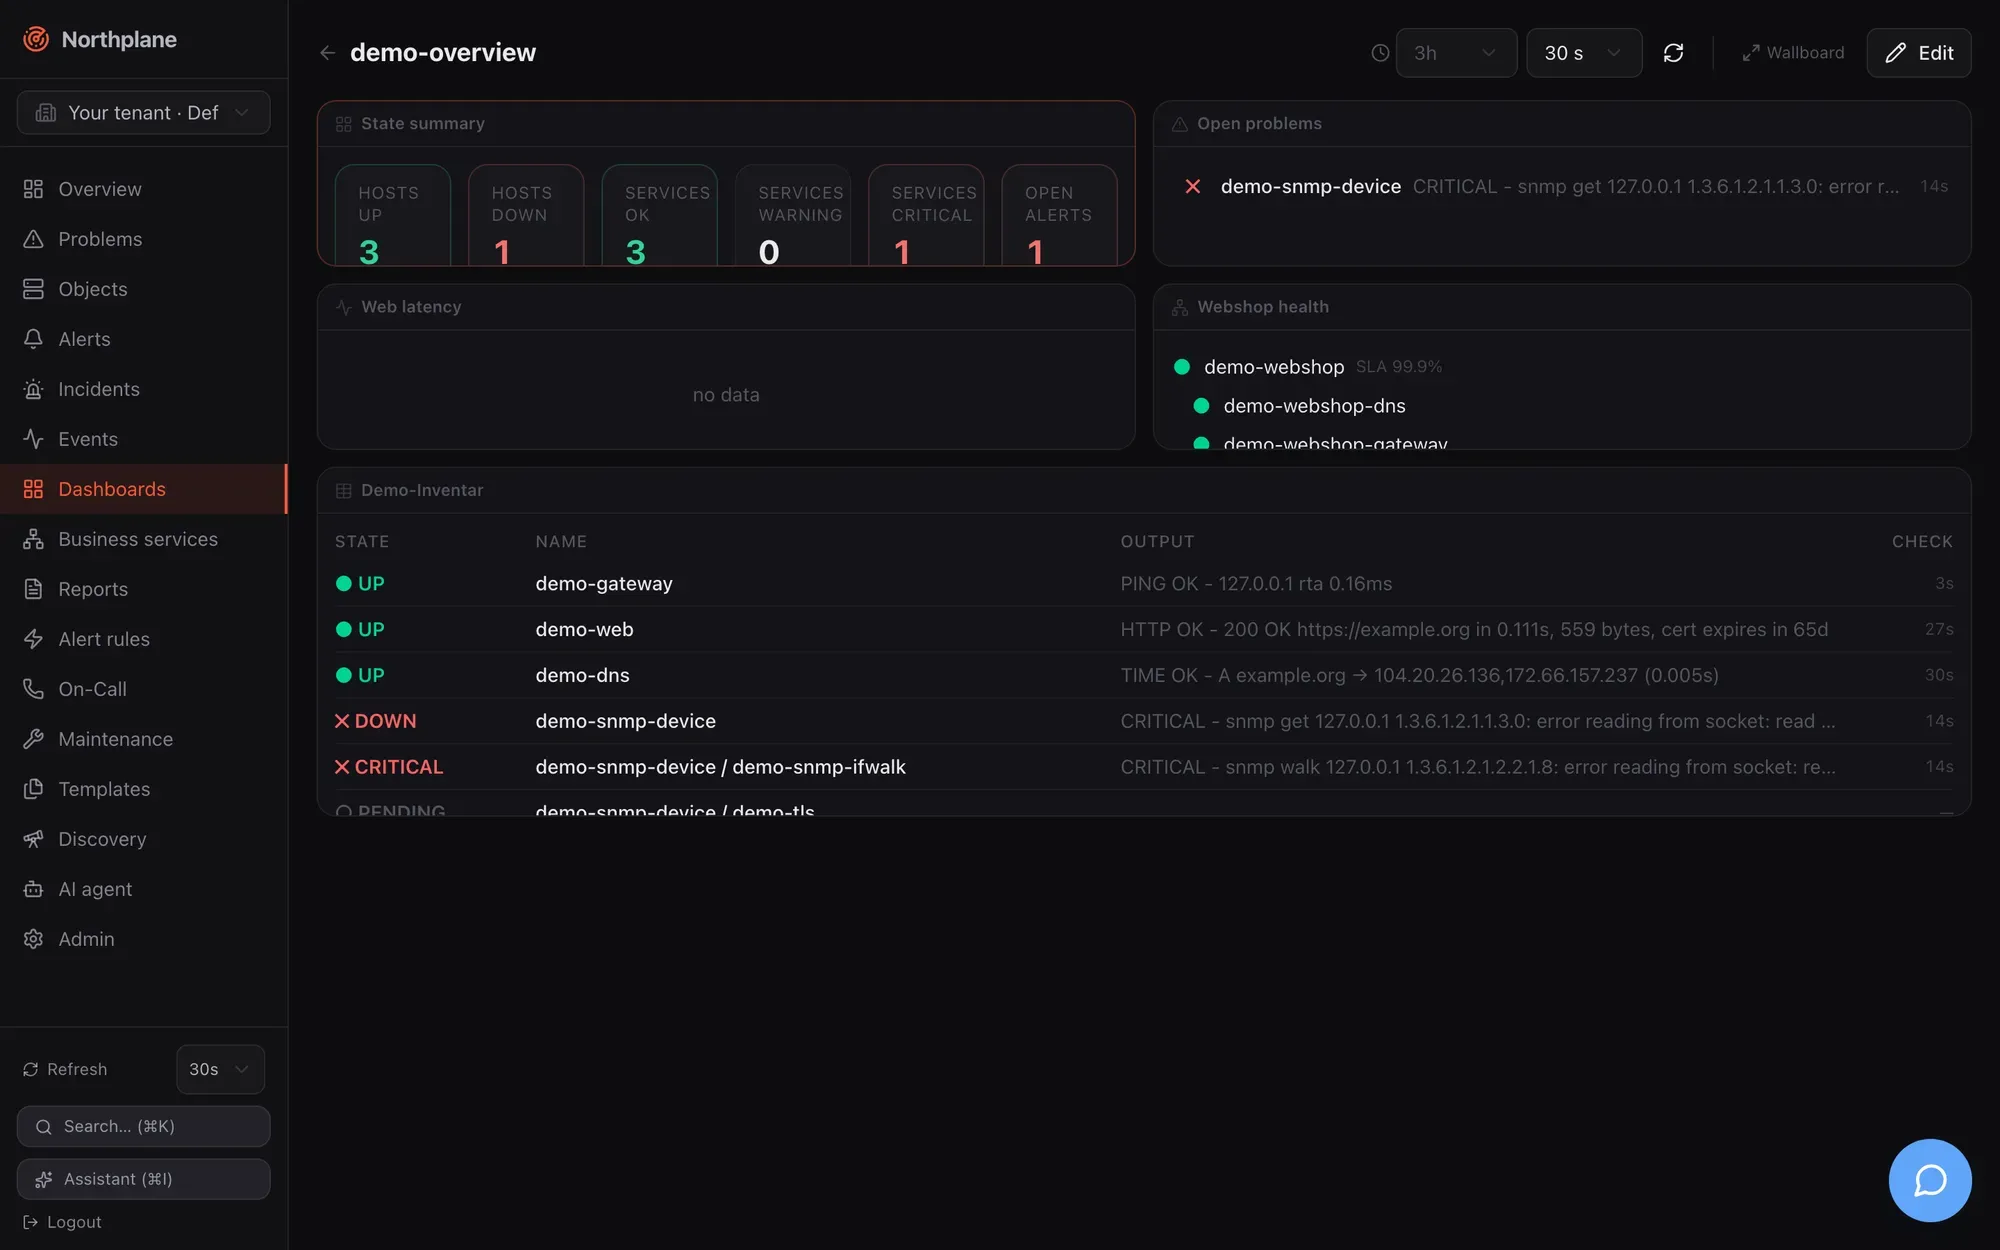
Section titled “Demo dashboard”Demo mode seeds the shared dashboard demo-overview (counters, problems, a metric chart of demo-web-latency over 3 h, the demo-webshop business service and a table with selector demo=true) — a good starting point to copy from.