
Overview and Problems
Overview (Übersicht) is the landing page of the UI and the page every g o chord and 404 link returns to. Problems (Probleme) is the working list for on-call engineers: every host or service that is currently not OK, with the three actions you need most — acknowledge, put into downtime, re-check. Both pages reload on the interval set by the refresh control.
Overview page
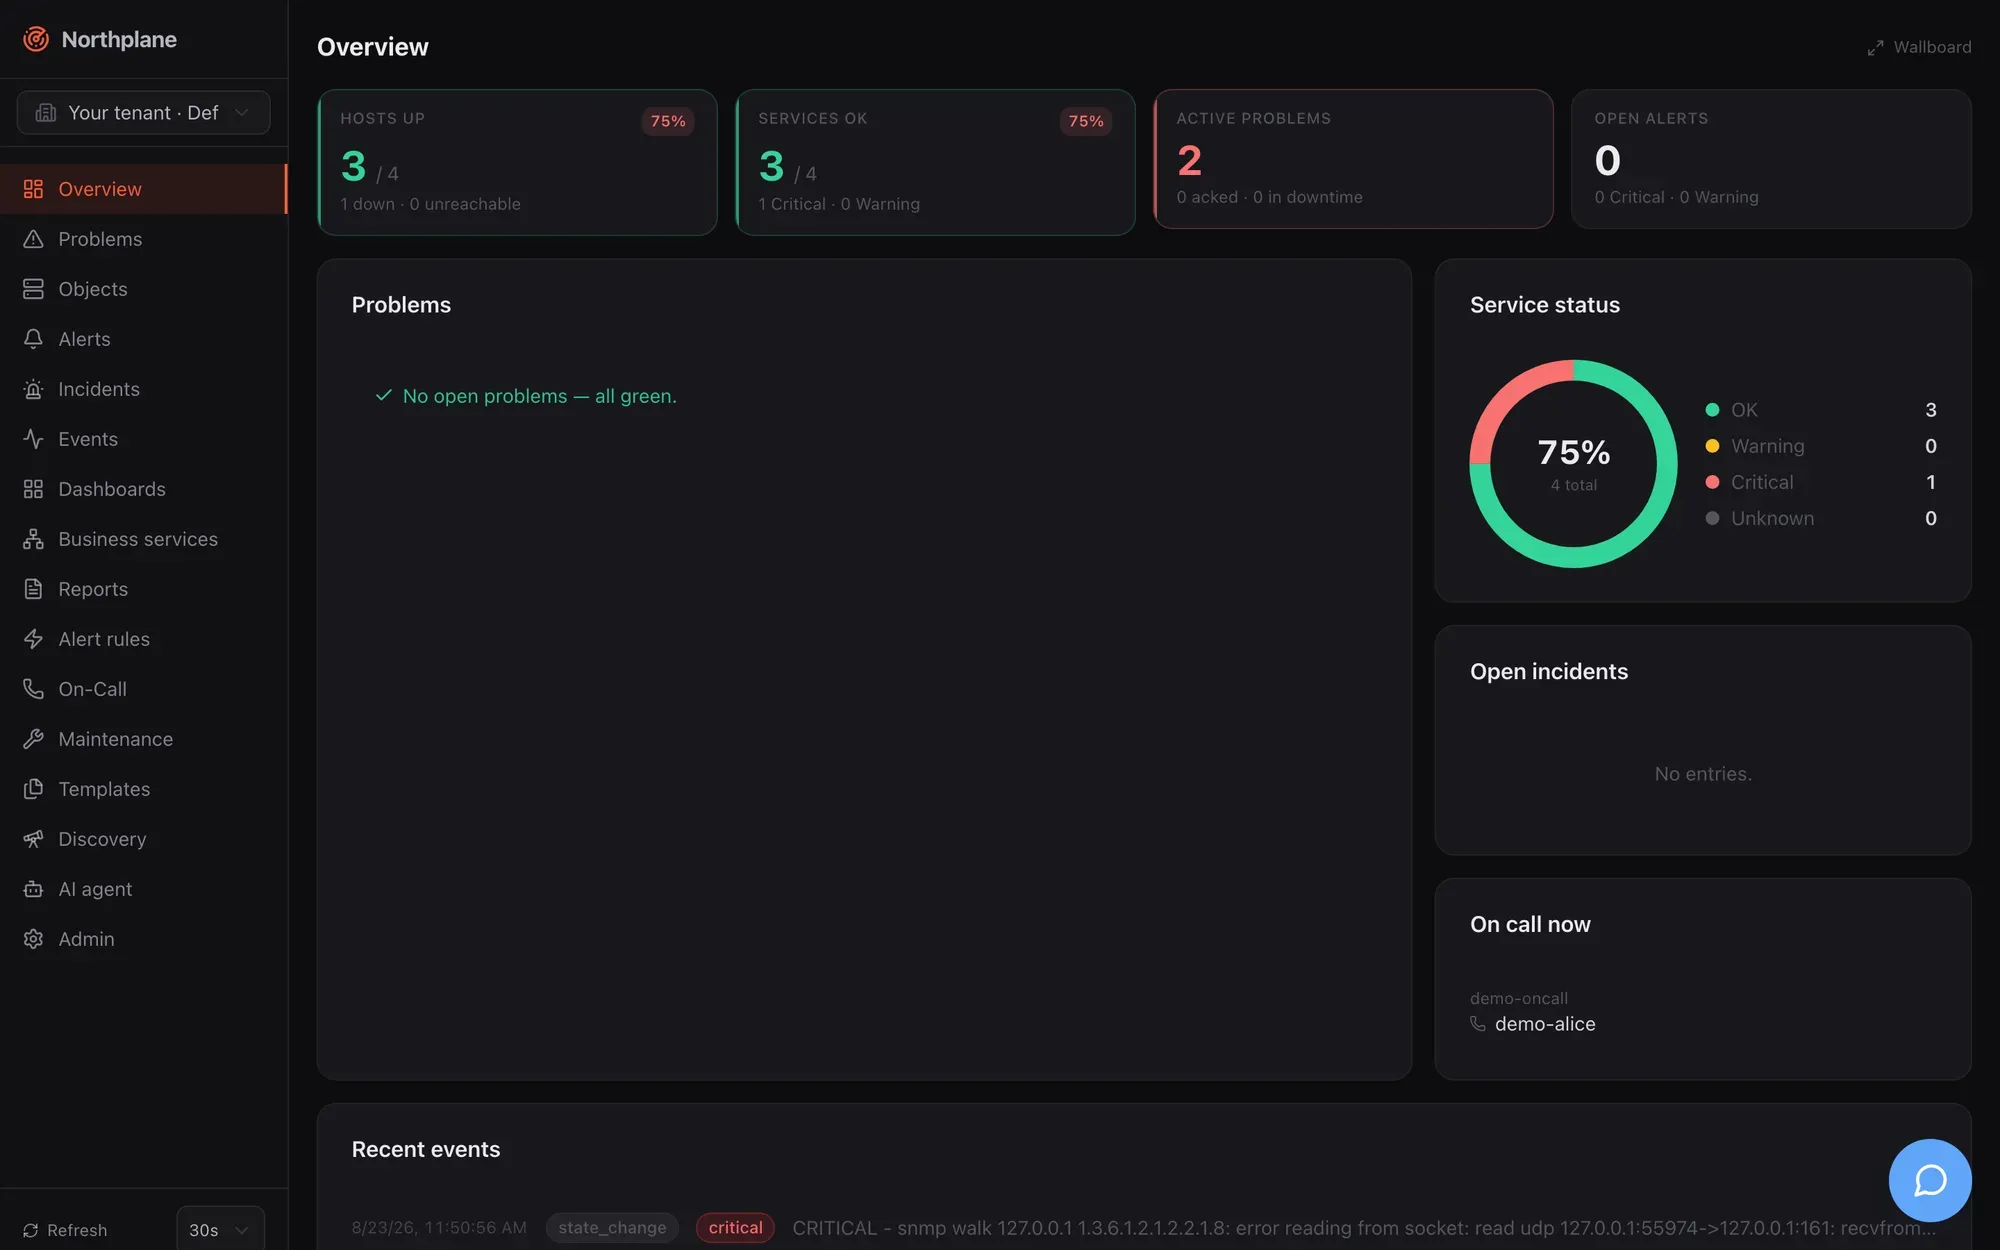
Section titled “Overview page”Route /. Data sources: GET /api/v1/overview (the summary; objects:read), GET /api/v1/oncall/now (refreshed every 60 s), GET /api/v1/problems?limit=15 and GET /api/v1/events?limit=20.
KPI tiles
Section titled “KPI tiles”Four stat cards across the top. Each is a link to a pre-filtered page.
| Tile (EN / DE) | Value | Badge | Sublabel | Links to |
|---|---|---|---|---|
| Hosts UP (Hosts UP) | hosts up / total hosts | percentage up; red when any host is down or unreachable | N down · N unreachable |
/objects?kind=host&state=up |
| Services OK (Services OK) | services OK / total services | percentage OK; red with any CRITICAL, amber with WARNING | N Critical · N Warning |
/objects?kind=service&state=ok |
| Active problems (Aktive Probleme) | hosts down + unreachable + services critical/warning/unknown | delta badge +N / -N = the last change of the counter between two polls (red when rising, green when falling; blank until it has moved once) |
N acked · N in downtime |
/problems |
| Open alerts (Offene Alarme) | open critical + warning alerts | same delta badge | N Critical · N Warning |
/alerts |
The delta badges are kept only in browser memory — they reset when you reload the tab.
Cards below the tiles
Section titled “Cards below the tiles”| Card (EN / DE) | Content | Source |
|---|---|---|
| Problems (Probleme) | Up to 15 rows: state icon + label, host / service name (link to the object), humanised check output, age since the last hard change. Empty state: “No open problems — all green.” |
GET /problems?limit=15 |
| Service status (Service-Status) | Donut with OK / Warning / Critical / Unknown segments and the healthy percentage in the centre. Segment colours follow the theme’s success/warning/danger tokens. | GET /overview |
| Open incidents (Offene Incidents) | Severity badge + title per open incident; links to /incidents. |
GET /overview |
| On call now (Aktuelle Bereitschaft) | One block per on-call schedule with the people on duty (name, phone). | GET /oncall/now |
| Recent events (Letzte Ereignisse) | The 20 newest events: time, type badge, state/severity badge, humanised output or summary. | GET /events?limit=20 |
Wallboard mode
Section titled “Wallboard mode”The Wallboard link in the page header (and the Wallboard command in the palette) opens /?wallboard=1: the sidebar disappears, the page shows the title “Northplane Wallboard” with a live clock ticking every second, the four KPI tiles and a large problem list. Refresh is fixed at 10 s regardless of your preference. A dashboard has the same mode under /dashboards/<name>?wallboard (see Dashboards). There is no public, unauthenticated wallboard URL — the browser must have a session.
Problems page
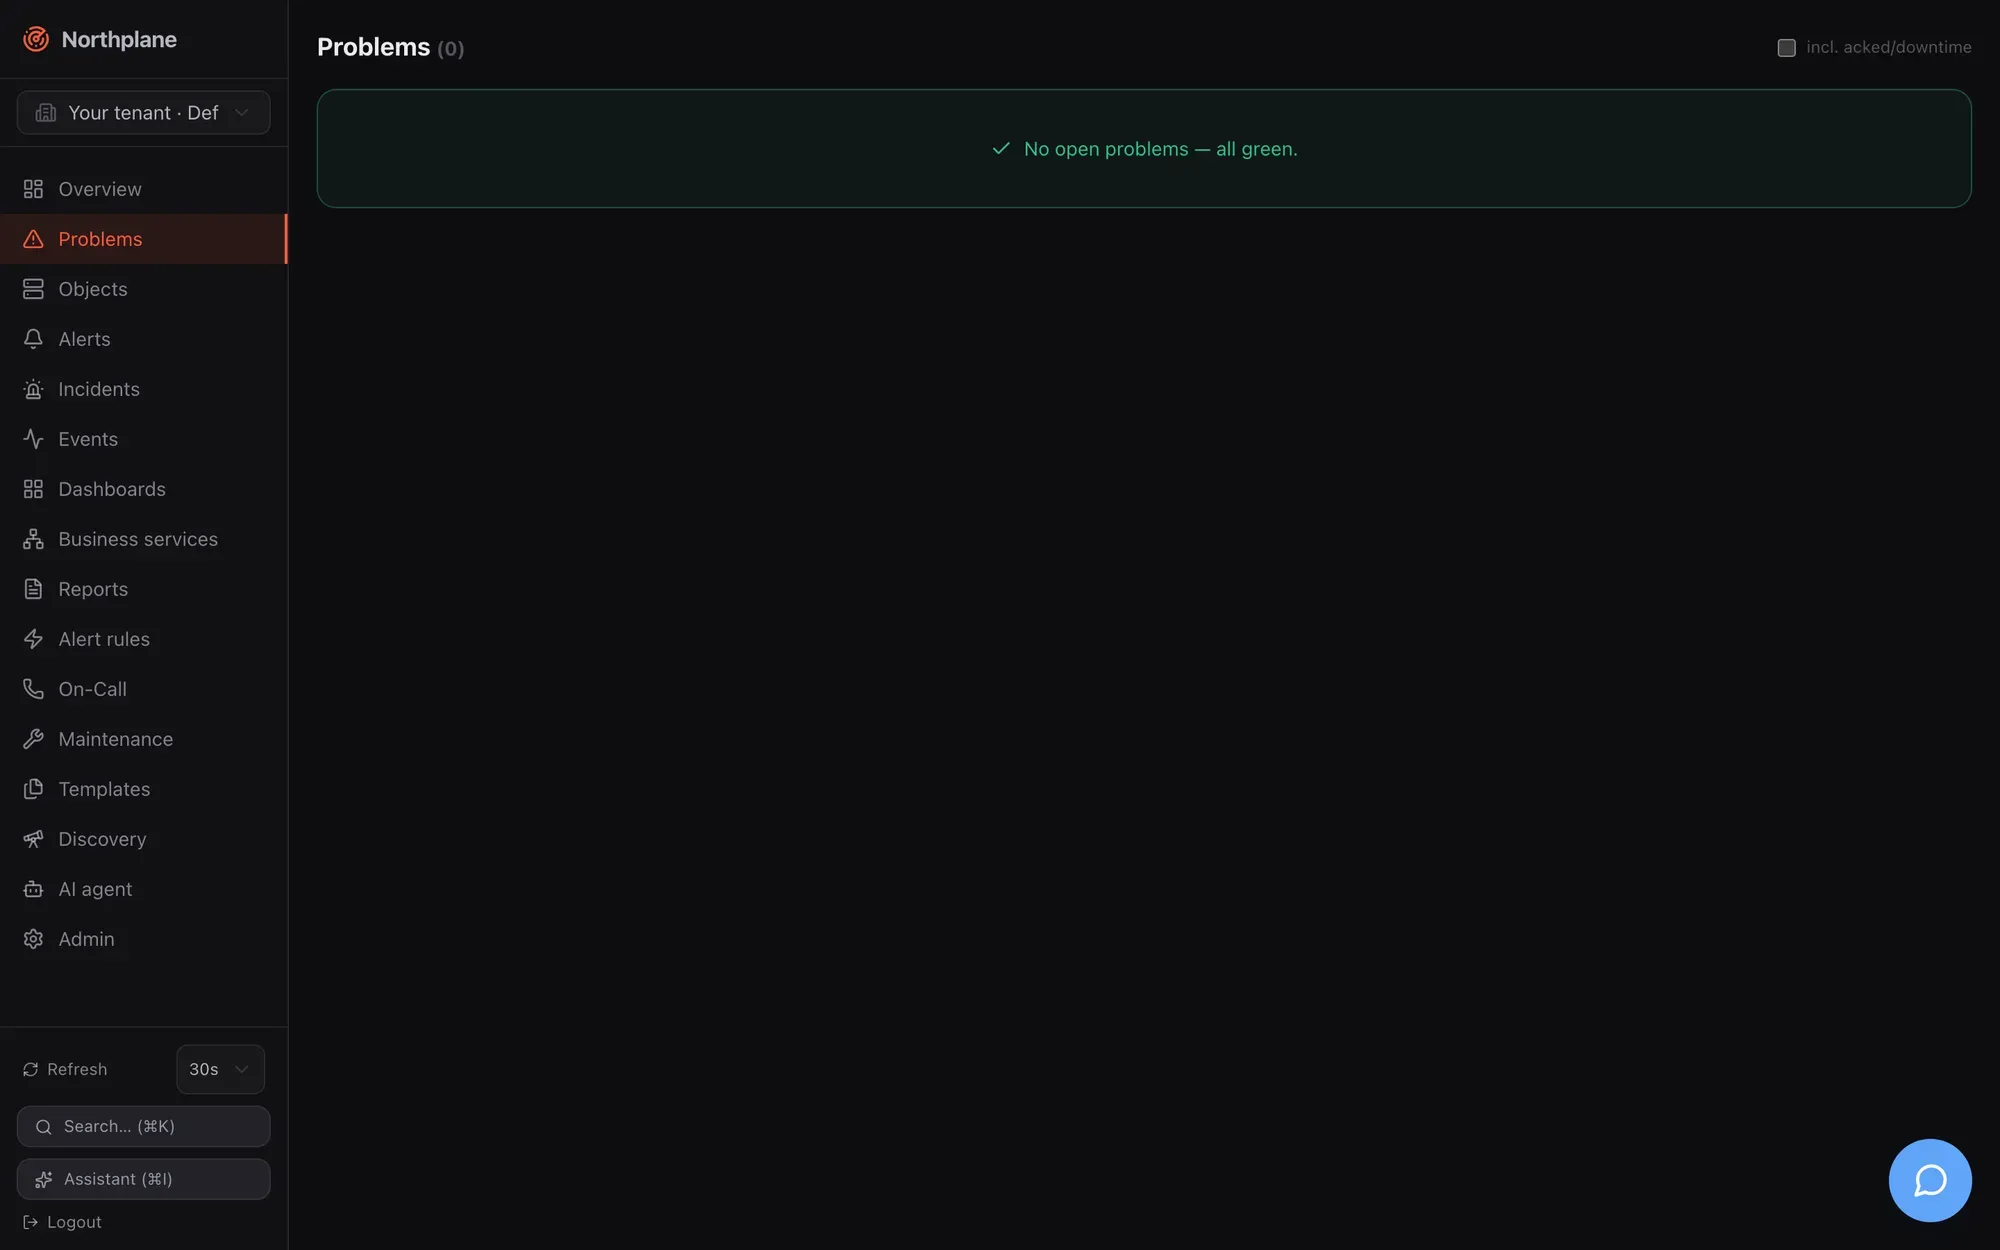
Section titled “Problems page”Route /problems. Data: GET /api/v1/problems?includeHandled=<bool> (objects:read) plus GET /api/v1/alerts?status=open&limit=500 (alerts:read), which the page uses to find the open alert that belongs to each object so that Acknowledge can target it.
| Element | Behaviour |
|---|---|
| Checkbox incl. acked/downtime (inkl. quittiert/Downtime) | Sets includeHandled=true: objects that are acknowledged or in a downtime are listed as well. Off by default. |
| Row | State badge, host / name (link to the object detail), check output, badges acked: by (quittiert), in downtime (in Downtime) and flapping (flattert) when applicable, and the age. |
| Empty state | “No open problems — all green.” (Keine offenen Probleme — alles grün.) |
Hover actions per row:
| Action (EN / DE) | Condition | What it does |
|---|---|---|
| Acknowledge (Quittieren) | Only when an open, not yet acknowledged alert exists for the object | Opens the Acknowledge dialog |
| Downtime (Downtime) | always | Opens the Downtime dialog |
| Check now (Jetzt prüfen, icon) | always | POST /api/v1/objects/{id}/check-now (checks:run); the list re-queries after 2 s |
The UI does not hide these actions from users who lack the permission — the API answers 403 and the dialog shows the error. Built-in viewer has none of alerts:ack, downtimes:write, checks:run; operator has all three (see Users, roles and permissions).
Acknowledge dialog
Section titled “Acknowledge dialog”Used from Problems, Alerts and the object detail. Title “Acknowledge — <object>” (Quittieren — …), the warning “Running escalations will stop.” (Laufende Eskalationen werden gestoppt.) and one Comment (Kommentar) input. Enter submits. The call is POST /api/v1/alerts/{id}:ack with {comment} (alerts:ack); afterwards the alert and problem lists are invalidated and reload.
What acknowledging means for escalation, the alarm app and the other ack paths (SMS keyword, IVR, ack link, np ack) is described in Acknowledge and snooze. Note that the dialog acknowledges the alert, not the object: an object with a problem but no open alert (for example because no alert rule matched) has nothing to acknowledge here, which is why the button only appears when an open alert exists.
Downtime dialog
Section titled “Downtime dialog”Also used from Problems and the object detail header. Fields: Hours (Stunden; number, default 2, step 0.5) and a required Comment (Kommentar). Submitting creates a fixed downtime starting now: POST /api/v1/downtimes with {objectId, type: "fixed", start: now, end: now + hours, comment} (downtimes:write). For flexible or recurring downtimes, selector-based downtimes and RRULEs use the Maintenance page (Maintenance); the suppression semantics (notifications, alerts, re-arm) are explained there as well.